
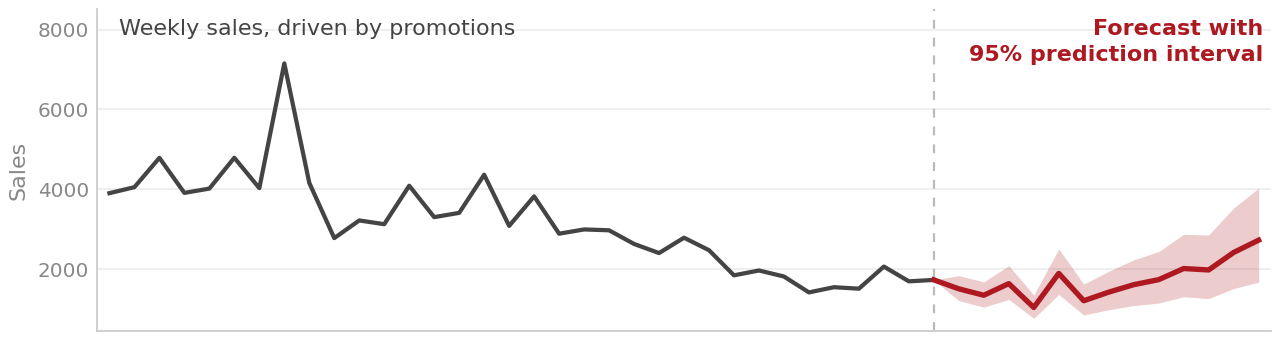
We start with your process, not your data. Before touching a model, we analyse how forecasting and replenishment actually work in your company: who produces the numbers, how they are used, which decisions they inform, and where they get overridden.
Only then do we move to the data: cleaning and analysing it, aligning the evaluation with the decisions it feeds, running experiments, and developing recommendations you can act on.
Where we help
Companies where forecasts drive stock decisions — retail, manufacturing, distribution, spare parts.
- Retailers and brands whose demand is driven by promotions, pricing and seasonality
- Manufacturers balancing component availability against working capital
- Distributors and wholesalers managing both fast movers and long tails
- Spare parts, MRO and aftermarket operations, where items move rarely and unpredictably
- Businesses with many SKUs, short histories, or several sales channels to reconcile
- Companies running ERP forecasting modules that nobody trusts but everybody uses
Our process
A month of work, and a written report you can act on with or without us.
Most engagements begin here. Before anyone commits to a larger project, we examine your current setup and tell you what is actually going wrong — and what fixing it is worth.
How you forecast today
We start by understanding your process: how forecasts are produced, what they are used for, and by whom. Which decisions depend on them, where judgement enters, and where the numbers get overridden. This tells us what already works and what is worth changing.
Whether it holds up
Then we measure it properly. How accurate your forecasts really are, and whether your error measures reflect the decisions they feed. Where demand is censored by stockouts, so your history understates what customers actually wanted. How your safety stocks are set, and whether they match the service levels you are targeting.
What you get
A written report with our findings and a prioritised list of actions, ranked by what they are worth and what they cost to implement. We present it to your team online or on-site. The report is yours to act on, with us or without us.
What it takes
A month of analysis and writing. From you: sales and stock data with the longest history you have either in Excel, CSV, or as direct access to your database.
Cost depends on the scale of the problem — a thousand SKUs is a different exercise from a hundred thousand, and a clean database export is different from a folder of spreadsheets. We scope it once we know what situation you have.
On messy data: we would rather have your real data than a tidy version of it. Gaps, inconsistencies, changed SKU codes, and spreadsheets assembled by hand are all normal. Working with data as it actually exists is part of the job.
What it is worth
Where the money actually comes from, and why the answer is usually not “a more accurate forecast”.
Stock you do not need
Safety stock set from the wrong numbers (or from a rule of thumb) ties up working capital in items that were never going to sell that fast. Correcting the calculation typically releases cash without touching service levels.
Sales you cannot make
The other failure mode, and the more expensive one: the item a customer wanted was not there. Lost sales typically do not appear in reports, which is why they persist.
The service level nobody chose
Most companies target a service level by convention rather than by calculation. In a recent analysis, moving from a 99% target to 90% roughly doubled profit on the items concerned, and a 99% target service level was loss-making across an entire product group — the inventory bill exceeded the margin it earned.
Planner time
When the system is not trusted, planners override it by hand. Most of those overrides make the forecast worse, and all of them cost time that a properly specified model would give back.
What any of this is worth depends on your margins, your holding costs and your lead times — which is what the diagnostic measures. We would rather put a number on your situation than quote someone else’s.
Selected work
Examples of the analysis we do, drawn from engagements conducted at Lancaster University’s Centre for Marketing Analytics and Forecasting. Client names are withheld.
Where the forecast was being undone by hand
A branded consumer goods manufacturer, around 1,500 products. We audited the forecasting process end to end and benchmarked the company’s own forecasts against nine suitable statistical methods.
The forecasts were adequate, but more than half of them were being adjusted manually. Separating the adjustments by size showed a clear pattern: moderate adjustments improved accuracy by around 58%, while adjustments of more than 2,000% made the forecast roughly twenty times worse. Most of the beneficial adjustments were planners correcting for promotions — something the statistical model could have handled directly, had it been given the promotional data.
Delivered: process audit, ABC-XYZ categorisation, and a set of rules for where judgement should and should not be used.
Testing a software vendor’s own engine
An analytics software company asked us to benchmark the forecasting approach inside their product against established methods, on nearly 20,000 intermittent retail series.
Their method was beaten on point accuracy by Croston and TSB, well established statistical methods that run in a fraction of the time. More seriously, their prediction intervals were badly miscalibrated: intervals sold as 85% covered only 73% of actual values, and some quantiles came back negative, which is unsuitable for demand. Such narrow intervals look good until they are translated into safety stock, at which point they lead to stockouts.
Delivered: benchmarking study, diagnosis of the interval problem, and a forecasting engine improvement roadmap.
What the stock policy was actually worth
An industrial distributor with a catalogue of roughly 33,000 SKUs, running replenishment through an ERP system. Demand was almost entirely intermittent: 82% of product-weeks had no sales at all.
We tested ten forecasting approaches (including statistical and ML), simulated an order-up-to policy at four service levels, and calculated costs of every strategy in the client’s own currency. The model that minimised costs turned out to be the wrong answer — it saved money by heavily understocking. Once profit replaced cost as the objective, a simple 12-week moving average at a 90% target service level won almost across the board, while a 99% target proved loss-making.
Delivered: a per-product recommendation file covering every active SKU, and a script that regenerates safety-stock targets whenever new data arrives.
What happens next
Training your team, or building what the diagnostic says needs building. You are not committed to either.
The diagnostic tells you where you stand. Where you go from there depends on what it finds — and you are under no obligation to continue with us.
Training your team
Often the highest-value next step. Many forecasting problems are not tooling problems but understanding problems: the methods are available, but nobody was taught when to use which. We run practitioner courses and bespoke training for planning teams.
Implementation
Where the recommendations need building rather than explaining. We develop forecasting and inventory models around your demand patterns, your drivers, your ERP, and your planning cycle — and make sure the output is something your planners can actually run each week.
How we work
Published methods, open-source software, and models your team can run without us.
The right method, not the fashionable one
We use machine learning where it earns its place, and statistical models where they do. Neural networks, gradient boosting and conformal methods beat conventional approaches on some problems and lose badly on others, particularly with short histories or sparse demand. Knowing which case you are in is the expertise.
Methods you can inspect
Our work runs on the open-source packages we build and maintain — smooth and greybox — grounded in a published methodology (ADAM) and benchmarked on international forecasting competition data. You can read exactly what our methods do before you hire us.
Explainable models
You can see what drives every number: which components the model uses, how much each demand driver contributes, and why the forecast changed since last month. That matters when a planner overrides a figure, when finance asks why the plan moved, or when a forecast has to be defended in a meeting. Models you cannot interrogate get quietly ignored, and then the process runs on judgement alone.
No software to buy
We are not reselling a platform. The tools are free and open source, so what you pay for is the analysis and the judgement, not a licence. Nothing we build locks you into us.
If your forecasts drive real inventory decisions, we should talk.
Book a free 30-minute intro call — no preparation needed. We will ask about your situation and tell you honestly whether and how we can help.
Prefer to write? Send us a message