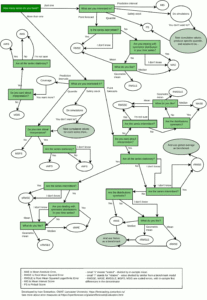
In order to help master students of Lancaster University Managemen Science department, I have developed a flow chart, that acts as a basic guide on what error measures to use in different circumstances. This is not a complete and far from perfect flow chart, and it assumes that the decision maker knows what intermittent demand is and what stationarity means. Nonetheless, it can be used for initial decision on what to use. All the error measures are explained in the ADAM textbook. Here is the flow chart (click to zoom in):
And here is the pdf version of it. Enjoy!


