When you start working with your data and suddenly realise that there are zeroes there, i.e. it is intermittent demand, what should you do first? Some people use SBC classification, but is that what you need? Let’s discuss!
Intermittent demand comes in different flavours: sometimes zeroes occur frequently with low demand volumes, while other times the volumes are high with occasional zeroes. Demand patterns can also change over time, with demand either becoming obsolete (more zeroes) or building up (fewer zeroes). How can we classify these different types of demand? Well, there is a paper on that (academic Rule 34)!
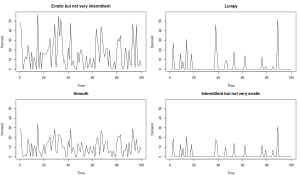
Syntetos, Boylan & Croston (2005) developed a categorization scheme using the Average Demand Interval (ADI) and Coefficient of Variation (CV). They compared MSE performance of Croston (1972) and SBA (Syntetos & Boylan, 2005) forecasting methods, creating four categories of intermittent demand with ADI=1.32 and CV²=0.49 as cut-off values:
1. Erratic but not very intermittent
2. Smooth
3. Lumpy
4. Intermittent but not very erratic
These are distinct categories of INTERMITTENT demand, though the names of the first and last are sometimes shortened to “Erratic” and “Intermittent,” causing confusion (intermittent demand can be intermittent?). The authors recommended using Croston for (1) and SBA for the other three. The image below illustrates these categories, with ADI increasing from left to right and CV increasing from bottom to top.
But that’s not all! Kostenko & Hyndman (2006) found that the split between Croston and SBA does not form four distinct areas – the cut-off should be non-linear. While mathematically correct, this classification has not gained as much popularity as SBC because it is more complicated. There is also a reply from Syntetos, Boylan & Croston to Kostenko & Hyndman, where the authors of the original classification agree with the new cut-off but also point out that their classification is practical, while not necessarily as accurate as KH.
Furthermore, Petropoulos & Kourentzes (2015) extended the KH classification by adding Simple Exponential Smoothing for regular demand, where the average inter-demand interval equals to one.
So, we have at least 3 popular techniques. So what?
These classifications were designed for conventional intermittent demand (e.g., spare parts) assuming stable ADI and CV over time. But what if demand builds up (fewer zeroes, higher volume) or slows down? In such cases, SBC, KH, and PK would be inappropriate. Moreover, classification should serve a purpose. SBC’s original purpose was to help choosing between Croston and SBA. So, the threshold between “lumpy” and “erratic” is based on these methods’ MSE performance. Are you using these methods in your case? If not, why bother with SBC/KH/PK classifications?
In the 2024, we have more advanced models and methods, and, for example, using SBC to decide between XGBoost and Poisson regression would be unwise. You need a different classification! Or maybe you don’t need one at all, just apply competing approaches and select the most appropriate one based on the holdout performance.
So, next time you work with intermittent demand, stop for a second and think what you plan to do. SBC is useful, but don’t use it just because you don’t know what to do!


More often I have seen the usage of ADI and CV to classify the demand type into 4 buckets.
How would you suggest one can go about understanding what the demand type of a product is ? If the goal is to only understand the type of demand for products at scale, is there a different way ?
Sorry for not replying earlier, somehow I missed this comment.
For me, the question is what you are going to do with that afterwards? If you want to use that to choose between different forecasting techniques, maybe just a simple split to “have zeroes/doesn’t have” would suffice. If it is just a curiosity, then who cares how you categorise the demand?
Also, have a look at this: https://openforecast.org/2025/04/11/svetunkov-sroginis-2025-model-based-demand-classification/ – I’ve been working with Anna Sroginis on an alternative classification. The main idea is to first understand whether the zeroes happen naturally or artificially and then do a classification to regular/intermittent (with lumpy/smooth inside). This paper is under review right now, when it gets published, I’ll write more about it (it has already changed a bit).