A bit of statistics
As mentioned in the previous post, all the details of models underlying functions of “smooth” package can be found in extensive documentation. Here I want to discuss several basic, important aspects of statistical model underlying es() and how it is implementated in R. Today we will have a look at basic pure additive models. These models do not have multiplicative components in them in any form and are very easy to implement and understand.
es() uses Single Source of Error State-Space model, described in Hyndman et al. (2008). The advantage of this is that it allows writing any type of exponential smoothing in a compact form and simplifies some statistical derivations. However the general model underlying es() differs slightly from the conventional one by Hyndman et al. (2008) – seasonal component is modelled using lags rather than dummy variables. There are some other differences, but we will not go into much details right now.
In general state-space model underlying es() is written as (for pure additive models):
\begin{equation} \label{eq:ssGeneralAdditive}
\begin{matrix}
y_t = w’ v_{t-l} + \epsilon_t \\
v_t = F v_{t-l} + g \epsilon_t
\end{matrix} ,
\end{equation}
where \(y_{t}\) is value of series on observation \(t\), \(v_{t}\) is a state vector (containing components of time series, such as level, trend, seasonality), \(w\) and \(F\) are predefined measurement vector and transition matrix and \(g\) is persistence vector (vector, containing smoothing parameters). Finally \(\epsilon_t\) is error term, which for additive model is assumed to be normally distributed.
Using these notations, all the additive exponential smoothing models can be united in one compact form \eqref{eq:ssGeneralAdditive}. For example, Damped trend model, ETS(A,Ad,N), has the following matrices:
\begin{equation} \label{eq:ssAAdNMatrices}
w = \begin{pmatrix}
1 \\ \phi
\end{pmatrix},
F = \begin{pmatrix}
1 & \phi \\
0 & \phi
\end{pmatrix},
g = \begin{pmatrix}
\alpha \\
\beta
\end{pmatrix},
v_t = \begin{pmatrix}
l_t \\
b_t
\end{pmatrix},
v_{t-l} = \begin{pmatrix}
l_{t-1} \\
b_{t-1}
\end{pmatrix},
\end{equation}
and can be represented in the system of the following equations:
\begin{equation} \label{eq:ssAAdN}
\begin{matrix}
y_t = l_{t-1} + \phi b_{t-1} + \epsilon_t \\
l_t = l_{t-1} + \phi b_{t-1} + \alpha \epsilon_t \\
b_t = \phi b_{t-1} + \beta \epsilon_t
\end{matrix} ,
\end{equation}
where \(l_t\) is level components, \(b_t\) is trend component, \(\phi\) is dampening parameter, \(\alpha\) and \(\beta\) are smoothing parameters.
Non-seasonal models in es() have exactly the same structure as in ets(). However the differences appear when we deal with seasonal components. The main element that is different in \eqref{eq:ssGeneralAdditive} in comparison with the conventional ETS is index \(l\), which indicates that some components of state vector have different lags. For example, seasonal component has a lag of \(m\) (for example, \(m=\)12 for monthly data) instead of 1, so some model ETS(A,A,A) has the following lagged state vector:
\begin{equation} \label{eq:ssETS(A,A,A)StateVector}
v_{t-l} =
\begin{pmatrix}
l_{t-1} \\
b_{t-1} \\
s_{t-m}
\end{pmatrix} ,
\end{equation}
where \(l_{t-1}\) is lagged level component, \(b_{t-1}\) is lagged trend component, \(s_{t-m}\) is lagged seasonal component and \(m\) is lag of seasonality. Inserting \eqref{eq:ssETS(A,A,A)StateVector} in \eqref{eq:ssGeneralAdditive} and substituting all the other elements with the appropriate values, leads to the following well-known model, which underlies additive Holt-Winters method:
\begin{equation} \label{eq:ssETS(A,A,A)}
\begin{matrix}
y_t = l_{t-1} + b_{t-1} + s_{t-m} + \epsilon_t \\
l_t = l_{t-1} + b_{t-1} + \alpha \epsilon_t \\
b_t = b_{t-1} + \beta \epsilon_t \\
s_t = s_{t-m} + \gamma \epsilon_t
\end{matrix} .
\end{equation}
In case of Hyndman et al. (2008) equation \eqref{eq:ssETS(A,A,A)} would contain \(m-\)1 more seasonal components, which would not be updated (claiming that their values are just moved to another observation). So the essence of the model would be the same, but it would be larger in size. By introducing the lagged structure of state vector, we decrease dimensions of \(v_t, w, F\) and \(g\). This simplifies some derivations and also means that normalisation of seasonal components needs to be done differently, than proposed by Hyndman et al. (2008). Point forecasts in this case should be similar to ets(), however prediction intervals and seasonal components could be potentially slightly different than in ets(). Although using lags instead of dummies can be considered as a substantial difference from modelling perspective, it does not change substantially the final forecasts, and all the statistical properties of the model are still there. For example, concentrated log-likelihood for models with additive errors is calculated in exactly the same manner as in the original ETS:
\begin{equation} \label{eq:ssConcentratedLogLikelihoodNorm}
\ell(\theta | Y) = -\frac{T}{2} \left( \log \left( 2 \pi e \right) +\log \left( \hat{\sigma}^2 \right) \right),
\end{equation}
where \(\theta\) is a set of parameters used in model and \(T\) is number of observations. This likelihood can be used for the purpose of estimation of models and selection of the most appropriate one via information criteria. We will discuss these elements in details in the upcoming posts.
A bit of examples in R
Let’s see some examples of usage of es(). We will use library “Mcomp”, so don’t forget to install it (if you haven’t done so before) and load it using library(Mcomp).
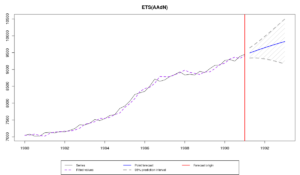
We start by estimating some model on a time series N1234. This time series has an obvious trend, and a safe option in forecasting of this sort of time series is using Damped trend method, which corresponds to ETS(A,Ad,N) model:
es(M3$N1234$x, "AAdN", h=8, intervals=TRUE)
This command produces two things: an output and the following graph:
If you don’t need a graph, ask function not to do it via silent=”graph”. If you don’t need an output, then write “smooth” object into some variable:
ourModel <- es(M3$N1234$x, "AAdN", h=8, intervals=TRUE, silent="graph")
In cases of model selection and combinations (which will be discussed later), you may want for the function to work really silently. You then need to specify silent="all" or silent=TRUE.
So, what do we have in that output? Let's see:
Time elapsed: 0.15 seconds
Model estimated: ETS(AAdN)
Persistence vector g:
alpha  beta
0.623 0.26
Damping parameter: 0.964
Initial values were optimised.
6 parameters were estimated in the process
Residuals standard deviation: 75.206
Cost function type: MSE; Cost function value: 4902

Information criteria:
     AIC     AICc      BIC
522.0857 524.2962 532.9256

95% parametric prediction intervals were constructed
The first two lines are self explanatory - all the process took 0.15 seconds and we have constructed damped-trend model.
"Persistence vector g" refers to the vector of smoothing parameters \(g\) in \eqref{eq:ssGeneralAdditive}. It consists of two smoothing parameters: \(\alpha\), for level of series, and \(\beta\), for the trend component. As we see, alpha is pretty high, which indicates that the level component evolves fast in time. Beta is higher than usual, which corresponds to changes of trend in time.
"Damping parameter" shows what is the value of parameter that damps trend. It is close to one, which means that the trend is damped slightly.
The next line tells us how the initial values of state vector \(v_0\) were estimated. This time they were optimised. However we could ask our function to do it differently. We may discuss this some other day, some other time.
After that we see the number of parameters estimated in the process. We get 6 because we have: 2 smoothing parameters, 2 initial values of state vector \(v_0\), 1 damping parameter and 1 estimated variance of residuals. The latter is needed in order to take the correct number of degree of freedom into account. And actually it is not fare to calculate the variance but not to take it into account.
Then we see the value of standard deviation of residuals. This is an unbiased estimate, corrected by the number of degrees of freedom. This means that it is calculated using:
\begin{equation} \label{eq:sd_Value}
s = \sqrt{\frac{1}{T-k} \sum_{t=1}^T e_t },
\end{equation}
where \(k\) is number of estimated parameters (in our example \(k=\)6). This value is reported just for the general information. It does not tell us much about the estimated model, although we could potentially compare models with additive error using this value... But not today.
The line about cost functions follows. We see that Mean Squared Error was used in the estimation and the final value is equal to 4902. Not really helpful for anything, just a general information.
"Information criteria" line and a table with values below it tell what they say - these are Akaike Information Criterion, it's correct version and Bayesian Information Criterion. These can be compared across different models applied to one and the same sample of data.
Finally, the function tells us that it has produced 95% parametric prediction intervals.
All of this in a way points out at what to expect in ourModel, when we decide to extract some values. Note that ourModel is a list of variables, so the values can be extracted as usual. For example, model name is saved in ourModel$model, while forecasts are stored in ourModel$forecast. The detailed description of returned values is given in the help for function in R.
Now let's make things more interesting and see how the same model performs in the holdout. We will use parameter holdout for this purpose:
y <- ts(c(M3$N1234$x,M3$N1234$xx),start=start(M3$N1234$x),frequency=frequency(M3$N1234$x))
es(y, "AAdN", h=8, holdout=TRUE, intervals=TRUE)
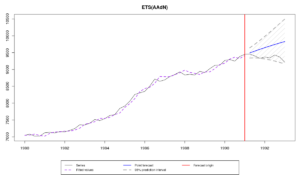
The resulting graph looks similar to the previous one with a small difference - we now have actual values in the holdout:
As it can be seen from the graph we didn't manage to produce forecasts close to the actual values, but at least prediction intervals cover them. The output gives us more information about that:
Time elapsed: 0.18 seconds
Model estimated: ETS(AAdN)
Persistence vector g:
alpha  beta
0.623 0.260
Damping parameter: 0.964
Initial values were optimised.
6 parameters were estimated in the process
Residuals standard deviation: 75.206
Cost function type: MSE; Cost function value: 4902

Information criteria:
     AIC     AICc      BIC
522.0857 524.2962 532.9256

95% parametric prediction intervals were constructed
88% of values are in the prediction interval
Forecast errors:
MPE: -3.2%; Bias: -100%; MAPE: 3.2%; SMAPE: 3.2%
MASE: 4.183; sMAE: 3.7%; RelMAE: 3.436; sMSE: 0.2%
The main difference between this output and the previous one is in last several lines. Now the function also informs us, in how many cases the prediction intervals covered actual values (88%) and what were the prediction errors for the holdout. The errors are:
- MPE - Mean Percentage Error;
- Bias - Coefficient based on Mean Root Error, measuring symmetry / bias in residuals. If it is 0, then there's no bias, otherwise there is either positive or negative bias. This coefficient lies in region from -100% to 100%;
- MAPE - Mean Absolute Percentage Error;
- SMAPE - Symmetric Mean Absolute Percentage Error;
- MASE - Mean Absolute Scaled Error;
- sMAE - Scaled Mean Absolute Error (MAE divided by mean absolute actual value);
- RelMAE - Relative Mean Absolute Error (comparison is done with Naive);
- sMSE - Scaled Mean Squared Error. This is scaled by dividing MSE by square of mean absolute actual value.
These error measures allow us assessing accuracy of the produced model. They do not mean much on their own, but can be compared across several models. For example, ETS(A,A,N) applied to the same data has:
MPE: -3.7%; Bias: -100%; MAPE: 3.7%; SMAPE: 3.6%
MASE: 4.82; sMAE: 4.3%; RelMAE: 3.958; sMSE: 0.2%
Comparing these errors with the errors of ETS(A,Ad,N), we can say that damped trend model performs slightly better than ETS(A,A,N).
The only meaningful metric in the list, that can be analysed on its own, is RelMAE, which shows us that our forecast is 3.436 times worse than Naive. Not really soothing...
All these errors are stored in ourModel$accuracy as a vector. Additionally, because we used holdout=TRUE in the estimation, now we have this part of data in a special variable - ourModel$holdout. This is handy, because allows calculating any other error measures you can think of.
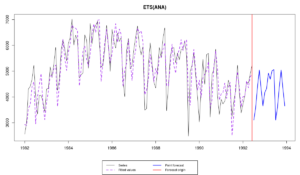
We have mentioned seasonal models in this post, so let's see how es() works with seasonal data on an example of ETS(A,N,A) model and time series N1956:
ourModel <- es(M3$N1956$x, "ANA", h=18)
The resulting graph should look like the following one:
There is not much to say about this graph, except that the model is fitted well and more or less adequate forecasts have been produced (at least nothing ridiculous). Obviously if we compare this model with the one estimated using ets(), we will see that there are some small differences. For example, smoothing parameters values and initial values will differ, which will lead to slightly different forecasts. Here's an example of forecasts for 6 months ahead produced by both functions:
| h | es() | ets() |
| 1 | 3106.583 | 3105.761 |
| 2 | 3592.868 | 3580.976 |
| 3 | 4395.580 | 4389.775 |
| 4 | 5044.109 | 5052.459 |
| 5 | 4305.332 | 4364.522 |
| 6 | 3650.615 | 3733.528 |
As we see, for some values the difference is almost non-existent (0.822 for \(h=\)1), but for the others it becomes larger (-82.913 for \(h=\)6). Still the overall difference between these two forecasts is around 0.43% (averaged out for the horizon of 1 to 6, scaled to the mean of the data), so it is not clear, which of the two forecasts is more adequate. This difference is not only caused by the structure of state vector, but also by the optimisers used in functions: the one used in es() is more precise, which however not necessarily transfers to increase in forecasting accuracy.
That's it for today. Next time we will look into models with multiplicative errors. They have some important differences in comparison with ets(), that we should discuss.


