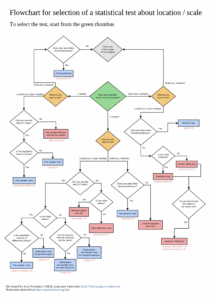
In Lancaster University, I teach the module called “Statistics and Descriptive Analytics”, which is compulsory for master students of the programme “Business Analytics“. This year, the module has been delivered by Alisa Yusupova and me, and I have prepared a flowchart that should (hopefully) help students decide, which of the statistical tests to use in different situations. This is in no way a full diagram, it mainly focuses on tests for the mean / median and variance, but it should be useful for the students and those who use statistical tests in their work. Here it is:
And here is the same thing in pdf


