2.3 How to choose appropriate error measure
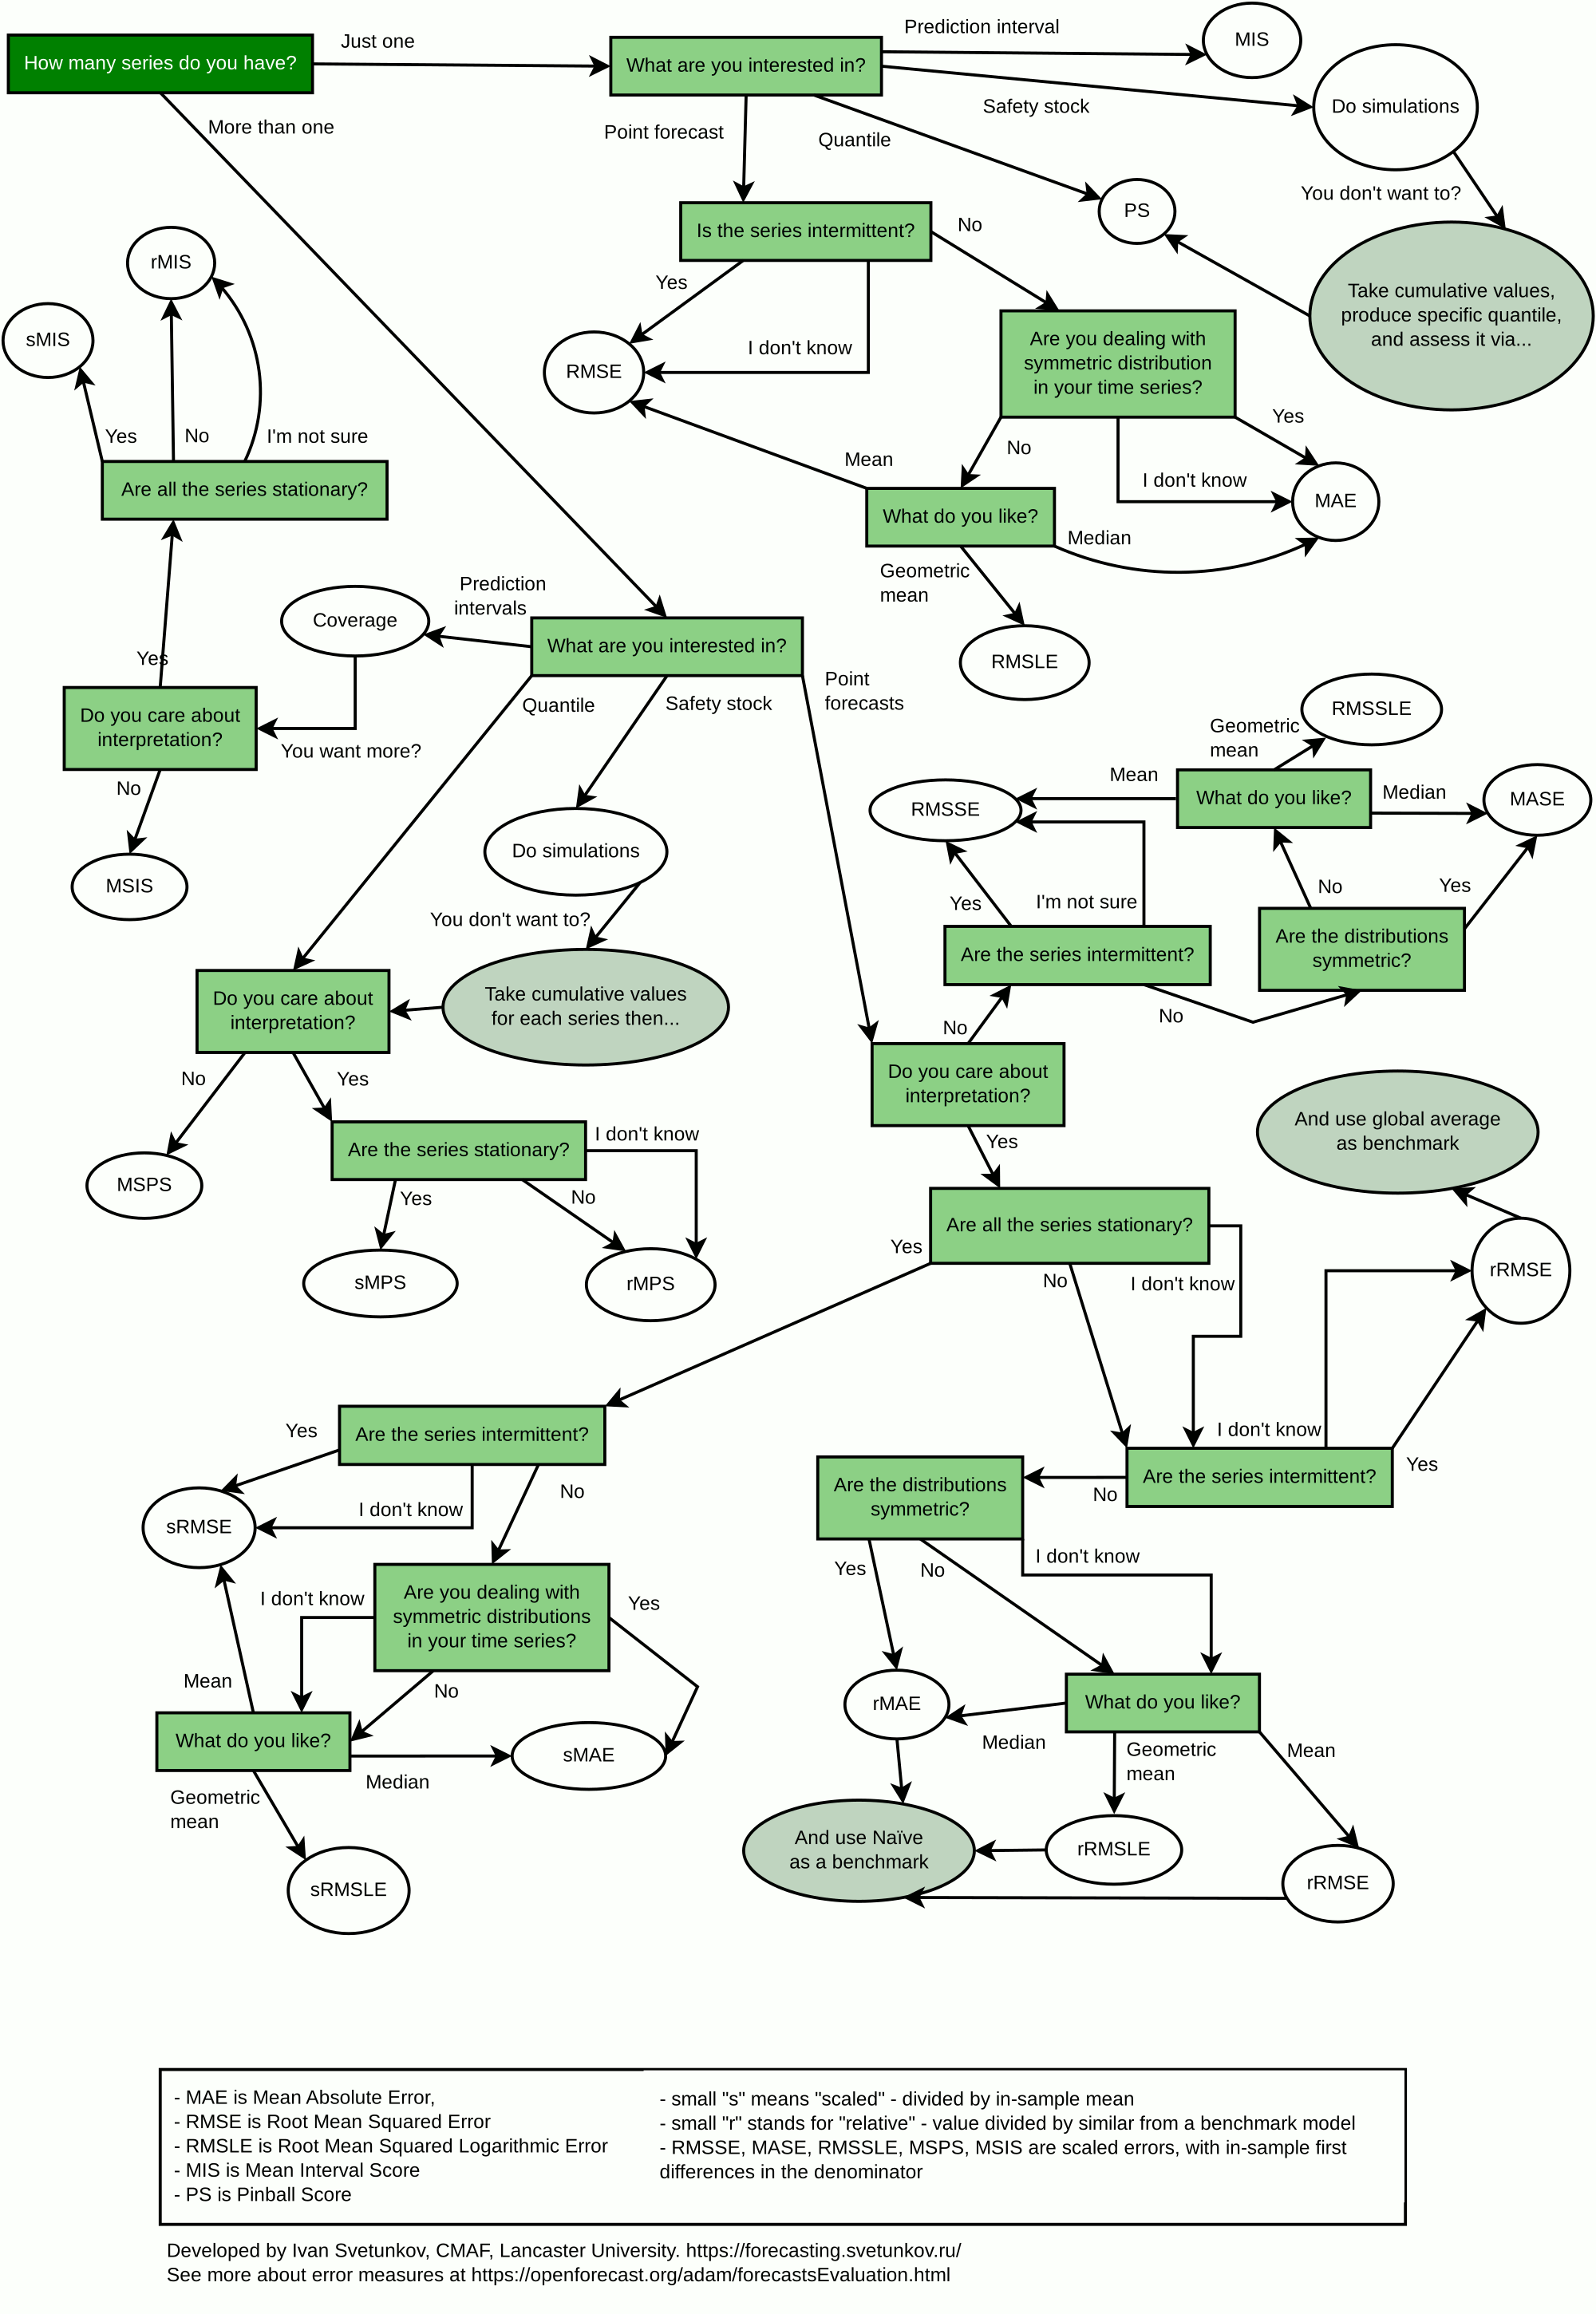
While, in general, the selection of error measures should be dictated by the specific problem at hand, some guidelines might be helpful in the process. I have summarised them in the flowchart in Figure 2.3.

Figure 2.3: Error measures selection flowchart.
The flowchart does not provide excessive options and simplifies the possible process. It does not discuss the quantile and interval measures in detail, as there are many options for them. The idea of the flowchart is to list the most important measures, and its aim is to provide a guideline for selection based on:
- Number of time series under consideration. If there are several of them and you need to aggregate the error measure, you need to use either scaled or relative ones. In the case of just one time series, you do not need to scale the error measure;
- What specifically you want to measure: point forecasts, quantiles, prediction interval, or something else;
- Whether the interpretability of the error measure is essential or not. If not, then scaled measures similar to Hyndman and Koehler (2006) can be used. If yes, then the choice is between relative and scaled using mean measures;
- Whether the data is stationary or not. If it is, then it is safe to use scaled measures similar to Petropoulos and Kourentzes (2015) because the division by the in-sample mean would be meaningful. Otherwise, you should either use Hyndman and Koehler (2006) scaling or relative measures;
- Whether the data is intermittent or not. If it is and you are interested in point forecasts, then you should use RMSE based measures – other measures might recommend zero forecast as the best one;
- Symmetry of distribution of demand. If it is symmetric (which does not happen very often), then the median will coincide with the mean and geometric mean, and it would not be important whether to use RMSE-, MAE-, or RMSLE- based measure. In that case, just use an MAE-based one (for simplicity reasons);
- What you need (denoted as “What do you like?” in the flowchart). If you are interested in mean performance, then use RMSE based measures. The median minimises MAE, and the geometric mean minimises RMSLE. This relates to the discussion in Section 1.3.
The point forecast related error measures have been discussed in Section 2.1, while the interval and quantile ones – in Section 2.2.
Remark. I personally do not recommend using MAPE and SMAPE (symmetric MAPE) for the reasons discussed by Goodwin and Lawton (1999) and Hyndman and Koehler (2006). In fact, any percentage-based error measure has severe limitations (see, for example, Svetunkov, 2024) and should be avoided if possible.
You can also download this flowchart in PDF format from the https://www.openforecast.org/adam/ website.