


If you work in the field of statistics, analytics, data science or forecasting, then you probably have already noticed that some of the instruments that are used in your field are called “methods”, while the others are called “models”. The issue here is that the people, using these terms, usually know the distinction between them, but rarely explain it to the others, implying that this is obvious. Well, it is, when you have worked in the field for several years. But it isn’t if you are a novice, who has only started the introduction to the statistical topics. So, I’ve decided to write this post in order to propose my understanding of the two terms, specifically focusing on the context of forecasting.
Cambridge dictionary defines method as a particular way of doing something, which is actually also quite a good definition for the “forecasting method”. For example, Simple Exponential Smoothing (SES) is a method, because it is a way of getting point forecasts. It does not have any specific assumptions and is based on a simple principle of filtering / smoothing the available data. See for yourself, here is the formula for SES:
\begin{equation} \label{eq:SES}
\hat{y}_{t+1} = \alpha y_{t} + (1-\alpha) \hat{y}_{t},
\end{equation}
where \(y_{t}\) is the actual value, \(\hat{y}_{t}\) is the predicted value on observation \(t\) and \(\alpha\) is the smoothing parameter (which is traditionally selected from the range (0, 1)). SES is very simple, it produces fast and quite accurate forecasts for the level data, but it does not explain, where the randomness in the data comes from. No wonder, because this is just a particular way of getting point forecasts.
Now, what about the model? I like the definition from the paper of Pidd (2010), which actually comes from his book “Tools for Thinking: Modelling in Management Science“: “model is an external and explicit representation of part of reality as seen by the people who wish to use that model to understand, to change, to manage and to control that part of reality“. There are several important elements in this definition:
- “representation of part of reality” – we cannot create a model of everything, we need to focus on something. Inevitably, the model is a simplification and it is needed in order to get some insights about a specific aspect of a real phenomenon;
- “an external and explicit representation” – model is something that is clearly defined. Your thoughts are just thoughts until you formalise them;
- “use that model to understand, to change, to manage and to control” – models need to have a purpose. Yes, there are those that are not useful, created just for the sake of themselves, but arguably they are at least created for fun / hype, which is already a purpose;
- Finally, “as seen by the people who wish to use that model” – models are subjective and depend on who creates them. Model created by my friend Nikos might differ substantially from a model created by me, just because we have different points of view.
There are different ways of classifying models, I like the following one, based on the model complexity / level of formalisation (from simpler to more complicated):
- Textual – those that are only described using words;
- Visual – those that are expressed via visual elements (images, figures, graphs);
- Mathematical – the ones, represented with mathematical formulae;
- Imitation – small, simplified copies of a real object / phenomenon;
For example, the classification of models above is a textual model on its own. It is a simplified representation of reality created for a specific purpose (in order to better understand what model is).
Here is an example of a visual model:
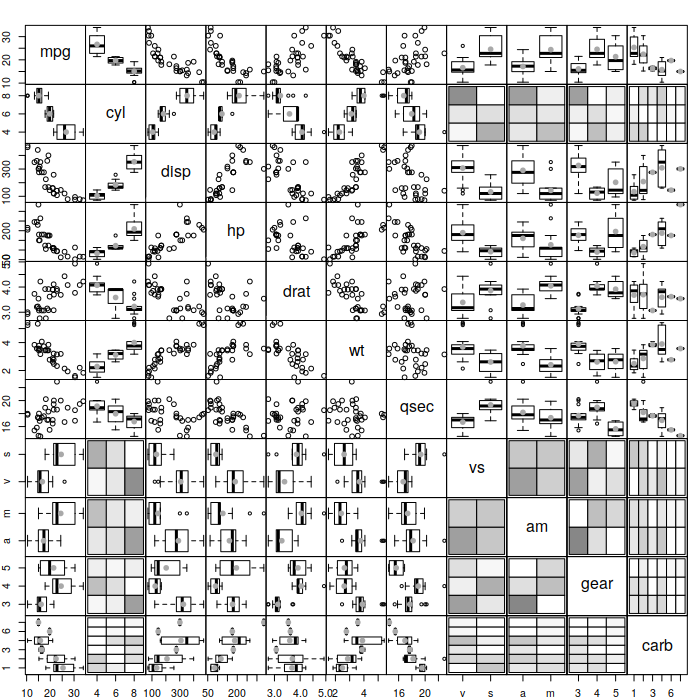
Spread matrix
Examples of imitation models include models of buildings, cities, cars (like this) etc, simulation models, focus groups and other. They are not exact copies of the real objects, but they imitate some of their aspects (the most important ones for specific purposes). For instance, a model of a car might be needed in order to understand, how the final product will look without constructing the proper vehicle. This way we simplify the process and get an understanding about some aspects of a phenomenon of interest.
And here is a simple mathematical model (in our case, this is a statistical one):
\begin{equation} \label{eq:Model}
{y}_{t} = \mu_t + \epsilon_{t},
\end{equation}
where \(\mu_t\) is the structure of the data, and \(\epsilon_{t}\) is the noise. This model represents a real data in a simplified form (e.g. the sales of a product can be explained using some structure and some unpredictable random fluctuations). It represents specific aspects of reality, it is created for purposes of analysis / forecasting, it is explicit, and it is created by me.
If we compare the model \eqref{eq:Model} with the method \eqref{eq:SES}, we might notice the important difference between them: the method does not explain what happens in the data, it just has a way of producing forecasts, while the model does a decomposition into structure and noise that allows looking into the process. This is the main difference between the two terms.
Now, moving this discussion to the forecasting domain, there are not many papers that acknowledge the difference between these terms explicitly. Chatfield et al. (2001) is one of the few sources that I know of that defines them properly: “…[forecasting] method, meaning a computational procedure for producing forecasts, and a [forecasting] model, meaning a mathematical representation of reality“. When John Boylan and I discussed these definitions, we have agreed that we were not satisfied with the one for the model, because it is too loose and might lead to confusion. For example, according to it, the following forecasting method might be erroneously considered as a model:
\begin{equation}
\begin{aligned}
{y}_{t} = & \eta_{t}, \text{where } \eta_{t} \sim \mathcal{Poisson}(\hat{y}_{t-1}-1)+1 \\
\hat{y}_{t} = & \alpha {y}_{t-1} + (1-\alpha) \hat{y}_{t-1}
\end{aligned} \label{eq:NotAModel}
\end{equation}
This is not a model, because it does not represent the reality, it uses the fitted values from previous observations in order to generate new ones. It does not explain, what the components in the data are and how they interact with each other, it is just a computational procedure for producing a distribution of values for forecasting purposes. Thus \eqref{eq:NotAModel} is a forecasting method, not a model. So, in our paper on iETS model, John and I have come up with the following two definitions:
- “…we define a forecasting model as a mathematical representation of a real phenomenon with a complete specification of distribution and parameters”;
- “A forecasting method is a mathematical procedure that generates point and / or interval forecasts, with or without a forecasting model”.
Note the difference between “mathematical representation” and “mathematical procedure” in the two definitions, and also note the stress on “complete specification of distribution and parameters” in the first one. This way we can distinguish forecasting model \eqref{eq:Model} from the forecasting method \eqref{eq:NotAModel}. And according to this definition, the following (based on \eqref{eq:NotAModel}) can be considered as a forecasting model:
\begin{equation}
\begin{aligned}
{y}_{t} = & \eta_{t}, \text{where } \eta_{t} \sim \mathcal{Poisson}(\mu_{t}) \\
\mu_{t} = & \mu_{t-1}(1 + \alpha \epsilon_t) ,
\end{aligned} \label{eq:AProperModel}
\end{equation}
where \(\mu_{t}\) is the structure and \(\epsilon_t\) is the random variable that follows some distribution.
I hope that we now understand the difference between the two terms, but I am sure that some of the readers of my blog are wondering: why bother to distinguish the two terms? This is because the forecasting methods either don’t make assumptions or make very few of them about the data, while the proper statistical models are based on some specific ones and can be quite restrictive. This can be strength and / or weakness for both of them. For example, SES can be applied to a wide variety of data, and will produce point forecasts, no matter what. But on its own, it won’t give you information about the uncertainty in the data, or how to properly estimate the model, or how to include some explanatory variables, or how to select between SES and Holt’s methods. At the same time, ETS(A,N,N) being a model underlying SES, can do all those things, but relies on the assumption of normality of the error term, along with several other typical for statistical models (such as homoscedastic and uncorrelated residuals, correct model specification, no influential outliers etc).
As you probably have already realised, there is no point in arguing, which of the two is better – both instruments are useful for different purposes. We should use whatever is suitable for each separate situation, but it might be important to understand the difference between the terms, if we want to make the world a better place.