


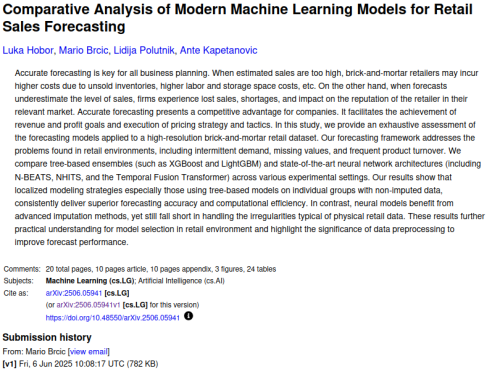
A couple of days ago, I noticed a link to the following paper in a post by Jack Rodenberg: https://arxiv.org/abs/2506.05941v1. The topic seemed interesting and relevant to my work, so I read it, only to find that the paper contains several serious flaws that compromise its findings. Let me explain.
Introduction
But first, why am I writing this post?
There’s growing interest in forecasting among data scientists, data engineers, ML experts etc. Many of them assume that they can apply their existing knowledge directly to this new area without reading domain-specific literature. As a result, we get a lot of “hit-or-miss” work: sometimes having promising ideas, but executed in ways that violate basic forecasting principles. The main problem with that is that if your experiment is not done correctly, your results might be compromised, i.e. your claims might be simply wrong.
If you’re a researcher writing forecasting-related papers, then hopefully reading this post (and the posts and papers I refer to), will help you improve your papers. This might lead to a smoother peer-review process. Also, while I can’t speak for other reviewers, if I come across a paper with similar issues, I typically give it a hard time.
I should also say that I am not a reviewer of this paper (I would not publish a review), but I merely decided to demonstrate what issues I can see when I read papers like that. The authors are just unlucky that I picked their paper…
Let’s start.
The authors apply several ML methods to retail data, compare their forecasting accuracy, and conclude that XGBoost and LightGBM outperform N-BEATS, NHITS, and Temporal Fusion Transformer. While the finding isn’t groundbreaking, additional evidence on a new dataset is always welcome.
Major issues
So, what’s wrong? Here is a list of the major comments:
- Forecast horizon vs. data frequency:
- Athanasopoulos and Kourentzes (2023) paper discusses data frequency and some decisions related to them;
- and there is a post on my website on a related topic
- Misuse of SBC classification:
- Read more about it here.
- And there is a post of Stephan Kolassa on exactly this point
- Product elimination and introduction is unclear (page 3):
- “Missing values” undefined:
- Figure 1 is vague:
- No stockout handling discussion:
- For example, see this post.
- Feature engineering is opaque:
- Training/validation setup not explained:
- Variables transformation is unclear:
- Forecast strategy not explained:
- I’ve written a post about the strategies.
- No statistical benchmarks:
- Issues with forecast evaluation:
- There is no point in reporting several error measures – each one of them is minimised by their own statistics. The error measure should align with what approaches produce.
- MSE, RMSE, MAE and ME should be dropped, because they are not scaled, so the authors are adding up error measures for bricks and nails. The result is meaningless.
- MASE is not needed – it is minimised by median, which could be a serious issue on intermittent demand see this post. wMAPE has similar issues because it is also based on MAE.
- If the point forecasts are produced in terms of medians (like in case of NBEATS), then RMSSE should be dropped, and MASE should be used instead.
- But also, comparing means with medians is not a good idea. If you assume a symmetric distribution, the two should coincide, but in general this might not hold.
- R2 is not a good measure of forecast accuracy. It makes some sense in regression context for linear models, but in this one, it is pointless, and only shows that the authors don’t fully understand what they are doing. Plus, it’s not clear how specifically it was calculated.
- I don’t fully understand “demand error”, “demand bias” and other measures, and the authors do not explain them in necessary detail. This needs to be added to the paper.
- The split into “Individual Groups” and “Whole Category” is not well explained either: it is not clear what this means, why, and how this was done.
- And in general, I don’t understand what the authors want to do with Cases A – D in Table 3. It is not clear why they are needed, and what they want to show with them. This is not explained in the paper.
- I have a series of posts on forecast evaluation here.
- Invalid analysis of bias measures:
- Disturbing bias of NBEATS in Figure 2:
- No inventory implications:
- Underexplained performance gaps:
Daily data with a 365-day forecast horizon makes no practical sense (page 2, paragraph 3). I haven’t seen any company making daily-level decisions a year in advance. Stock decisions are typically made on much shorter horizons, and if you need a year ahead forecast, you definitely do not need it on the daily level. After all, there is no point in knowing that on 22nd December 2025 you will have the expected demand of 35.457 units – it is too far into the future to make any difference. Some references:
Claiming that 70% of products are “intermittent” (page 2, last paragraph) based on SBC is incorrect. Furthermore, SBC classification does not make sense in this setting, and is not used in the paper anyway, so the authors should just drop it.
The authors say “Around 30% of products were eliminated during training and 10% are newly introduced in validation”. It’s not clear why this was done and how specifically. This needs to be explained in more detail.
It is not clear what the authors mean by “missing values” (page 3, “Handling Missing Values”). How do they appear and why? Are they the same as stockouts, or were there some other issues in the data? This needs to be explained in more detail.
Figure 1 is supposed to explain how the missing values were treated. But the whole imputation process is questionable, because it is not clear how well it worked in comparison with alternatives and how reasonable it is to have an imputed series that look more erratic than the original one. The discussion of that needs to be expanded with some insights from the business problem.
The authors do not discuss whether the data has stockouts or not. This becomes especially important in retail, because if the stockouts are not treated correctly, you would end up forecasting sales instead of demand
“Lag and rolling-window statistics for sales and promotional indicators were created” (page 3, “Feature Engineering”) – it is not clear, what specific lags, what length of rolling windows, and what statistics (anything besides mean?) were created. These need to be explained for transparency and so that a reader could better understand what specifically was done. Without this explanation, it is not clear whether the features are sensible at all.
It is not clear how specifically the split into training and validation sets was done (page 3, last paragraph), and whether the authors used rolling origin (aka time series cross-validation). If they did random splits, that could cause some issues, because the first law of time series is not to break its structure!
It is not clear whether any transformations of the response variable were done. For example, if the data is not stationary, taking differences might be necessary to capture the trend and to do extrapolation correctly. Normalisation of variables is also important for neural networks, unless this is built-in in the functions the authors used. This is not discussed in the paper.
It is not clear whether the direct or recursive strategy was used for forecasting. If lags were not used in the model, that would not matter, but they are, so this becomes a potential issue. Also, if the authors used the lag of the actual value on observation 235 steps ahead to produce forecast for 236 steps ahead, then this is another fundamental issue, because that implies that the forecast horizon is just 1 step ahead, and not 365, as the authors claim. This needs to be explained in more detail.
At the very least, the authors should use simple moving average and probably exponential smoothing. Even if they do not perform well, this gives an additional information about the performance of the other approaches. Without them, the claims about good performance of the used ML approaches are not supported by evidence. The authors claim that they used mean as a benchmark, but its performance is not discussed in the paper.
The whole Table 3 with error measures is an example of what not to do. Here are some of major issues:
Analysis of bias measures is meaningless because they were not scaled.
The bias shown in Figure 2 is disturbing and should be dealt with prior to evaluation. It could have appeared due to the loss function used for training or because the data was not pre-processed correctly. Leaving it as is and blaming NBEATS for this does not sound reasonable to me.
The authors mention inventory management, but stop on forecasting, not showing how the specific forecasts translate to inventory decisions. If this paper was to be submitted to any operations-related journal, the inventory implications would need to be added in the discussion.
The paper also does not explain well why neural networks performed worse than gradient boosting methods. They mention that this could be due to the effect of missing values, but this is a speculation rather than an explanation, which I personally do not believe (I might be wrong). While the overall results make sense for me personally, if you want to publish a good paper, you need to provide a more detailed answer to the question “why?”.
Minor issues
I also have three minor comments:
- “many product series are censored” (page 2, last paragraph) is not what it sounds like. The authors imply that the histories are short, while the usual interpretation is that the sales are lower than the demand, so the values are censored. I would rewrite this.
- Figure 2 has the legend saying “Poisson” three times, not providing any useful information. This is probably just a mistake, which can easily be fixed.
- There are no references to Table 2 and Figure 3 in the paper. It is not clear why they are needed. Every table and figure should be referred to and explained.
Conclusions
Overall, the paper has a sensible idea, but I feel that the authors need to learn more about forecasting principles and that they have not read forecasting literature carefully to understand how specifically the experiments should be designed, what to do, and not to do (stop using SBC!). Because they made several serious mistakes, I feel that the results of the paper are compromised and might not be correct.
P.S. If I were a reviewer of this paper, I would recommend either “reject and resubmit” or a “major revision” (if the former option was not available).
P.P.S. If the authors of the paper are reading this, I hope you find these comments useful. If you have not submitted the paper yet, I’d suggest to take some of them (if not all) into account. Hopefully, this will smooth the submission process for you.