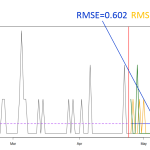
Vector Exponential Smoothing with PIC restrictions

About the paper. Introduction When you follow academics on social media, you typically see many success stories. This person published a paper in Management Science; another one published in EJOR; your colleague from a different university created a great package; and there is also an academic who is ten years younger than you and has […]

Introducing scale model in greybox

At the end of June 2021, I released the greybox package version 1.0.0. This was a major release, introducing new functionality, but I did not have time to write a separate post about it because of the teaching and lack of free time. Finally, Christmas has arrived, and I could spend several hours preparing the […]

Statistical tests flowchart

In Lancaster University, I teach the module called “Statistics and Descriptive Analytics”, which is compulsory for master students of the programme “Business Analytics“. This year, the module has been delivered by Alisa Yusupova and me, and I have prepared a flowchart that should (hopefully) help students decide, which of the statistical tests to use in […]

An Integrated Method for Estimation and Optimisation

My PhD student, Congzheng Liu (co-supervised with Adam Letchford) has written a paper, entitled “Newsvendor Problems: An Integrated Method for Estimation and Optimisation“. This paper has recently been published in EJOR. In this paper we build upon the existing Ban & Rudin (2019) approach for newsvendor problem, showing that in case of the linear model, […]

Stochastic coherency in forecast reconciliation

My student (co-supervised with Nikos Kourentzes), Kandrika F. Pritularga has written a paper on “Stochastic coherency in forecast reconciliation”, which has been recently published in International Journal of Production Economics (here it is). This paper contributes to the field of hierarchical forecasting, the main issue of which is that the forecasts produced on different levels […]

Error Measures Flow Chart

In order to help master students of Lancaster University Managemen Science department, I have developed a flow chart, that acts as a basic guide on what error measures to use in different circumstances. This is not a complete and far from perfect flow chart, and it assumes that the decision maker knows what intermittent demand […]

ISF2021: How to Make Multiplicative ETS Work for You

This year International Symposium on Forecasting was held online, although Centre for Marketing Analytics and Forecasting of Lancaster University had their own hub, where we would come and watch presentations together and even present to the others. I presented on the topic of Multiplicative ETS, based on this chapter of the ADAM textbook and on […]

Multi-step Estimators and Shrinkage Effect in Time Series Models – presentation for CEBA

Today I have made a presentation on the topic of “Multi-step Estimators and Shrinkage Effect in Time Series Models” for Center for Econometrics and Business Analytics (CEBA) of St.Petersburg State University. This presentation was based on the paper with the similar name written by Ivan Svetunkov, Nikolaos Kourentzes and Rebecca Killick. In the presentation, I […]

After the creation of ADAM: smooth v3.1.0

Since the previous post on “The Creation of ADAM“, I had difficulties finding time to code anything, but I still managed to fix some bugs, implement a couple of features and make changes, important enough to call the next version of package smooth “3.1.0”. Here is what’s new: A new algorithm for ARIMA order selection […]