
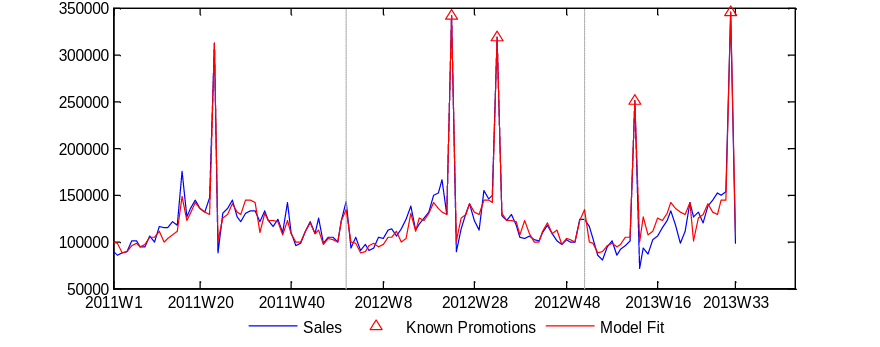
About a year and a half ago, I wrote a post about the challenges of seasonal data, focusing on daylight saving time and leap years. Since then, I’ve been asked about weekly data, which is what we typically have in supply chains. So, here is a short follow-up.
A year has 365.25/7 ≈ 52.18 weeks on average. This is typically resolved by having 53 weeks in some years (roughly once every five to six years). If you just use a seasonal model with 52 weeks, the pattern drifts by about a day every year, and after five or six years, your Christmas peak is a whole week off.
And there is a twist. Many tools do not use ISO weeks. Some count seven-day blocks from the 1st of January (e.g. lubridate::week() in R), so the last one or two days of the year form a “week 53”. Others follow the weekdays but cut the weeks at the start of the year (e.g. WEEKNUM() in Excel by default), so the first and last weeks may contain only a few days. If weekly demand is the sum of daily sales, these short weeks show sharp drops, although nothing has happened to demand. A rough fix is to model the average daily demand per week and scale the forecast back. A better one is to aggregate daily data into ISO weeks in the first place (e.g. with lubridate::isoweek() in R or ISOWEEKNUM() in Excel), which are always full seven-day weeks.
This leaves us with the 52/53 weeks, for which there are several options, each with its own assumptions:
- Shift the seasonal lag from 52 to 53 in years with the extra week. No additional parameters, but it assumes that week 53 behaves like week 52, which is not true if Christmas falls into it.
- Use categorical variables for weeks of the year. This avoids that assumption, but you need to estimate the effect of week 53, which you observe once every five to six years, if at all.
- Use fractional seasonality, e.g. TBATS (De Livera, Hyndman & Snyder, 2011: https://doi.org/10.1198/jasa.2011.tm09771), which models seasonality with harmonics and accepts the period of 52.18. This handles the drift elegantly, but you need to select the number of harmonics, and the harmonics might miss sharp peaks, like Black Friday.
- Pre-process the data, e.g. merge week 53 with week 52. This assumes that the merged week does not matter, while it often contains the peak you care about the most.
So, which one to use? There is no universal answer. In practice, it often depends on your software and its restrictions, e.g. if it does not support categorical variables, the second option is gone. But whatever you choose, be aware of the assumptions behind it.
In the next post, I’ll tell you about the new TBATS implementation in the smooth package, which handles fractional seasonality and has some features that other implementations don’t. Stay tuned!