
Have you used the Average Demand Interval (ADI) for analysis or classification? Do you know that it has some issues? Let me explain.
I don’t know when specifically ADI was proposed, but it was popularised by Syntetos, Boylan & Croston (2005), yes, the same Croston from this post. A demand interval is the number of periods between consecutive non-zero demands, and ADI is just their mean. It lies between one (demand in every period) and, theoretically, infinity (no demand at all). But why would anyone need it?
Originally, it was used together with the coefficient of variation \(CV^2 \) to classify demand into four types (the SBC classification) and to choose between Croston’s method and SBA. The authors compared the theoretical MSE of the methods and found cut-off points: Croston does better only when \(ADI < 1.32\) and \(CV^2 < 0.49\). Otherwise, SBA wins.
My interpretation of the \(ADI < 1.32\) (this is not in the paper): SBA fixes the bias of Croston’s method, which matters most for very slow-moving products. But it does that at a cost. SBA multiplies Croston’s forecast by \( (1 − \alpha /2) \), which just lowers probability of occurrence. If demand becomes less sporadic, SBA underestimates it (e.g. 0.85 instead of 0.9 with \(\alpha = 0.1\)).
But why ADI in the first place? Because historically the main academic work on intermittent demand was carried out in spare parts and similar domains, where sales are rare even at the monthly level (the 2005 paper used 3000 series from the automotive industry). When the probability of occurrence is low, demand does not evolve much over time, so averaging the demand intervals is acceptable.
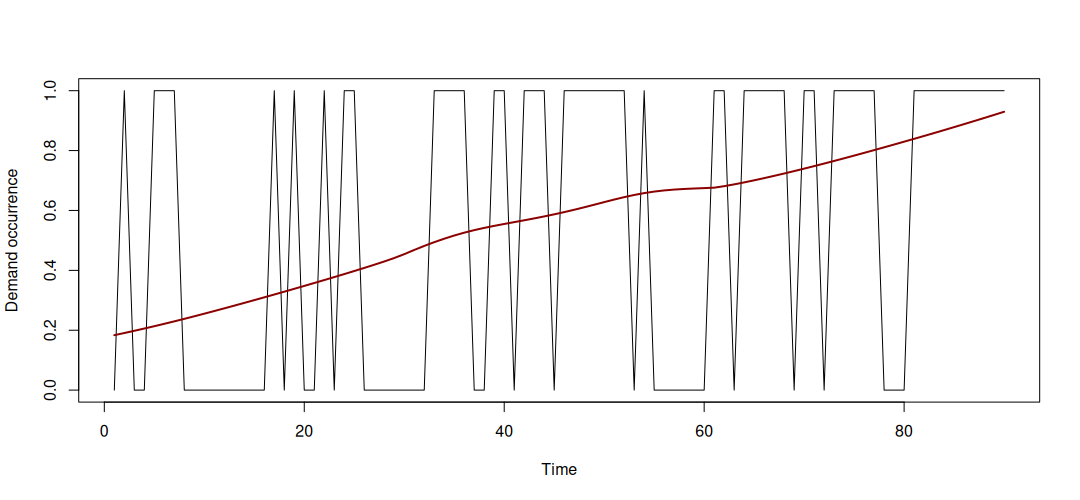
Nowadays, we face intermittent demand everywhere: in retail, energy, healthcare and other areas. The data is often collected at a more granular level (weekly or daily), and intermittent demand comes in more complex shapes than in spare parts. Averaging the intervals then hides important information. For example, if your product becomes obsolete halfway through the sample and the probability of occurrence drops from 0.5 to 0.1, ADI will be around 3.3. That corresponds to a probability of 0.3: neither the 0.5 you had nor the 0.1 you have now. It is like judging a hospital by the average temperature of all its patients.
So, ADI is a fine measure for its original purpose. But time has passed, use cases have changed, and nowadays instead of averaging the intervals, I recommend looking at how the probability of occurrence evolves over time, for example, by smoothing it (see the image in the post) or with a model that has a time-varying probability (like iETS). A plot of demand occurrence over time tells you more than ADI ever will.
We have a separate session on intermittent demand in our Demand Forecasting Principles course, where we cover this and other topics in detail.