Why Naive is not a good benchmark for intermittent demand

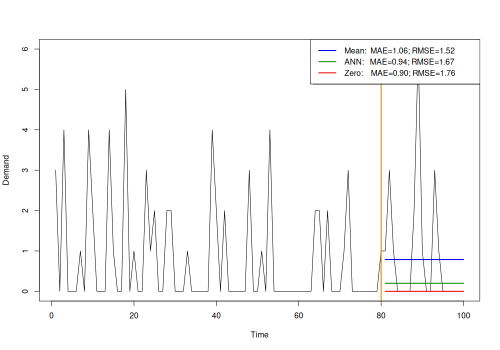
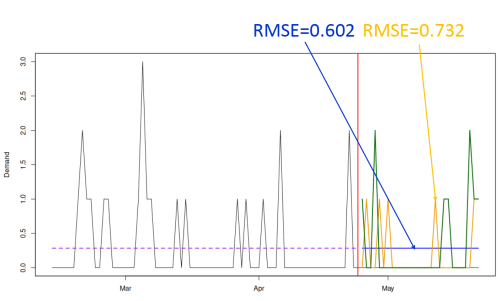
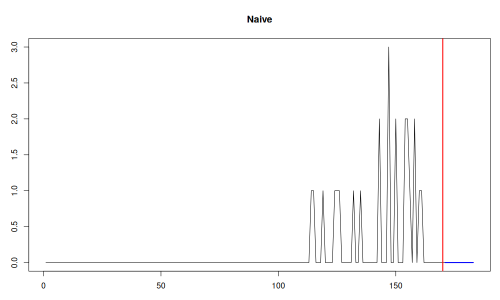
While Naive is considered a standard benchmark in forecasting, there is a case where it might not be a good one: intermittent demand. And here is why I think so. Naive is a forecasting method that uses the last available observation as a forecast for the next ones. It does not have any parameters to … Read more

Why zeroes happen

Anna Sroginis and I have been working on a new approach for intermittent demand classification over the past year. We’ve taken a fresh look at the problem, starting by asking: why do zeroes happen? Let’s discuss why indeed. First, a quick note: it’s a mistake to define intermittent demand simply as “demand with zeroes”. That … Read more

Why is it hard to beat the Simple Moving Average?

Intermittent demand and a forecast

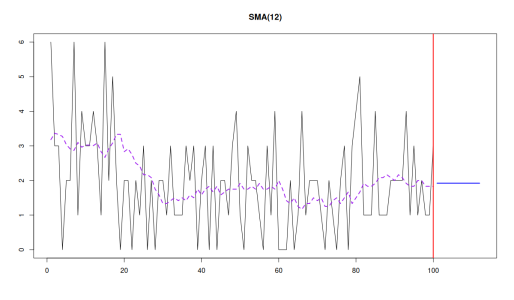
Simple Moving Average (SMA) is one of the basic forecasting methods. It doesn’t rely on time series decomposition, doesn’t have a seasonal component, and doesn’t include explanatory variables. Yet, in a supply chain context, SMA is sometimes a tough benchmark to beat. Why? First things first, SMA is simply the arithmetic mean of several recent … Read more

What about the training/test sets?

Train on a test site... maybe

Another question my students sometimes ask is how to define the sizes for the training and test sets in a forecasting experiment. If you’ve done data mining or machine learning, you’re likely familiar with this concept. But when it comes to forecasting, there are a few nuances. Let’s discuss. First and foremost, in forecasting, the … Read more

How to choose forecast horizon?

One of the questions my students sometimes ask is how to set the forecast horizon. The answer depends largely on the task at hand, but there are still some guidelines. First, the forecast horizon depends on data granularity. A “year ahead” forecast on monthly data means forecasting 12 steps ahead, while for daily data, it … Read more

Straight line is just fine

Two forecasts for some data

Look at the image above. Which forecast seems more appropriate: the red straight line (1) or the purple wavy line (2)? Many demand planners might choose option 2, thinking it better captures the ups and downs. But, in many cases, the straight line is just fine. Here’s why. In a previous post on Structure vs. … Read more

Are all forecasts wrong?

You’ve probably heard the phrase “all forecasts are wrong”, suggesting that the future is unpredictable and that no forecast will ever match the actual outcome. Well, this phrase is not entirely correct, and here’s why. When your favourite forecasting approach generates point forecasts, it usually provides a conditional mean. This means it’s giving you the … Read more

Structure vs. Noise: A Fundamental Concept in Forecasting

Structure vs Noise. Cloud in the shape of mushroom

One of the core ideas in statistics, which extends to many other fields including forecasting, is the concept of structure versus noise. You’ve probably heard of it, but it’s often overlooked by those without a strong quantitative background. So, let’s discuss. The core of the idea is that any data consists of two fundamental parts: … Read more

Intermittent demand classifications: is that what you need?

When you start working with your data and suddenly realise that there are zeroes there, i.e. it is intermittent demand, what should you do first? Some people use SBC classification, but is that what you need? Let’s discuss! Intermittent demand comes in different flavours: sometimes zeroes occur frequently with low demand volumes, while other times … Read more