6.5 Prediction interval
If we are interested in capturing the uncertainty about the random variable \(y\), then we should refer to prediction interval. In this case, we typically rely on LLN and the assumed distribution for the random variable \(y\). For example, if we know that \(y \sim \mathcal{N}(\mu, \sigma^2)\), then based on our sample we can construct a prediction interval of the width \(1-\alpha\): \[\begin{equation} y \in (\bar{y} + z_{\alpha/2} s, \bar{y} + z_{1-\alpha/2} s), \tag{6.5} \end{equation}\] where \(z_{\alpha/2}\) is the z-statistics (quantile of standard normal distribution) for the level \(\alpha/2\) and \(\bar{y}\) is the sample estimate of \(\mu\) and \(s\) is the sample estimate of \(\sigma\). The graphical presentation of such interval can be shown as in Figure 6.11.
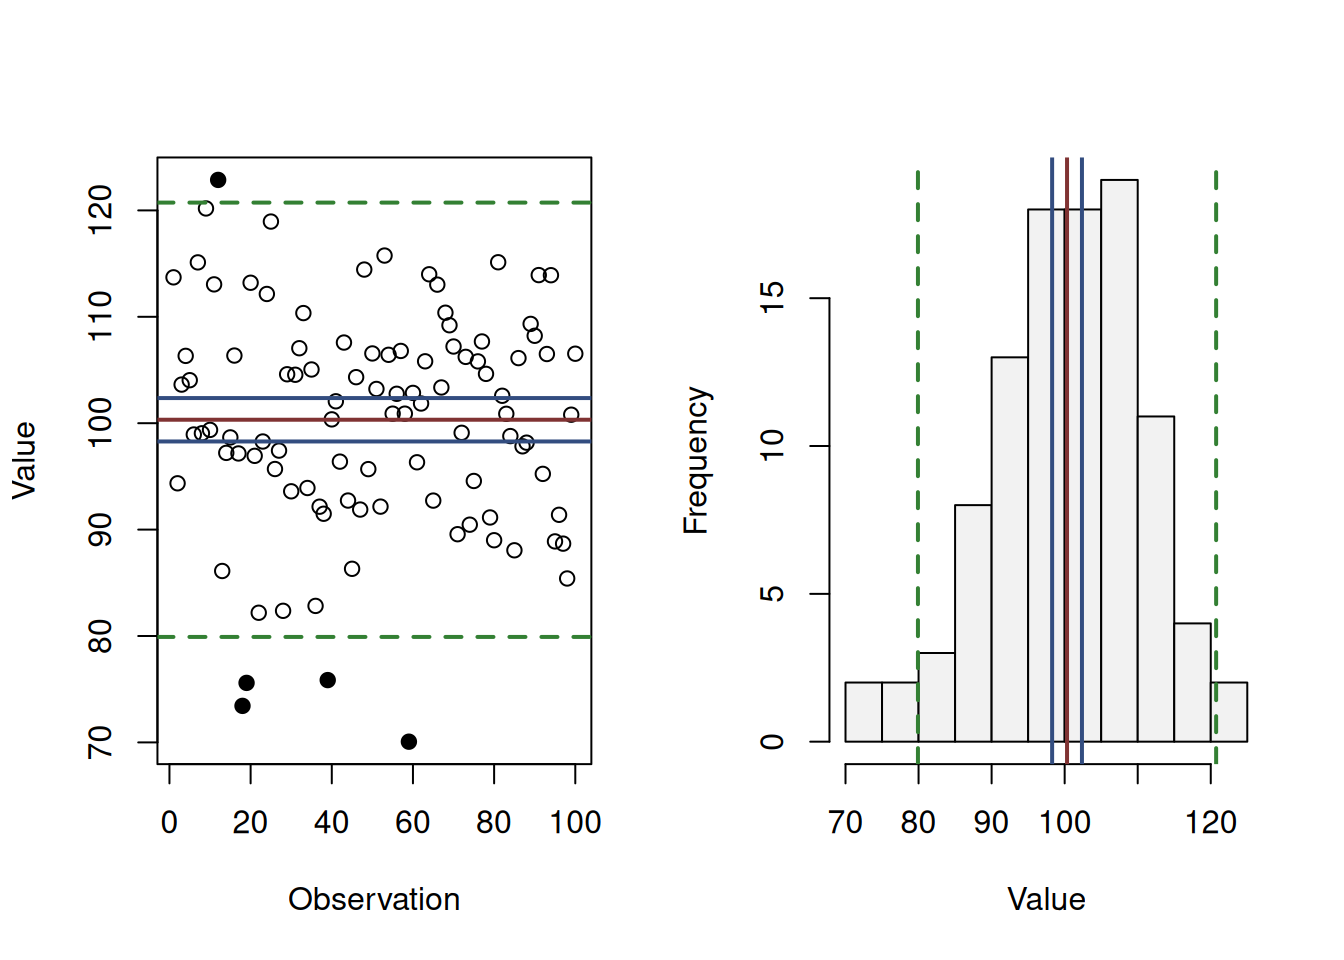
Figure 6.11: Artificial data, mean, confidence and prediction intervals.
Figure 6.11 shows the 95% prediction interval on two plots: the linear plot of values vs observations id and on the histogram. In both cases the prediction intervals are the dashed orange lines, lying further away from the sample mean (the solid blue line). The two solid red lines around the mean represent the 95% confidence intervals for the mean (discussed in Section 6.4). As can be seen, the prediction intervals show, where the 95% of observations are expected to lie. As a result, several observations lie outside the bounds (given the sample of 100 observations, we would expect 5 of them to lie outside, but this will vary from one sample to another). In contrast, confidence interval shows, where the expectation of the population will lie in 95% of the cases, if the interval is constructed many times for random samples.
The formula (6.5) relies on the assumption of normality. If it does not hold, the formula would change. In a way, the prediction interval just comes to getting the quantiles of the assumed distribution based on estimated parameters. In some cases, when some of the assumptions do not hold, we might switch to more advanced methods for prediction interval construction.