6.1 An Introduction to Sampling
Consider an example of a tyre manufacturer wanting to know the average lifetime of a new product line. How can they make sure that their tyres meet the expectations? Testing every single tyre to failure would be practically impossible and would leave nothing to sell. They have to rely on a sample of data, i.e. some small proportion of the whole, which is representative enough to capture the desired statistics correctly.
Another example, is a government health agency needing weekly updates on infection rates; surveying every single citizen is simply impossible from a time and cost perspective. In this case, the only way forward is also to collect a sample from the overall population of citizens. And by examining a carefully selected fraction of a population, we can make remarkably accurate and reliable inferences about the whole.
6.1.1 The Wisdom and Folly of Crowds
Before diving into formal definitions and mathematical principles, consider an example of how sampling works in a real-world context. Back in 2021, we conducted a simple survey among a sample of students at the university, asking them to estimate the price of a typical AAA computer game. Not everyone knew what this was, but they were asked nonetheless to guess. This way we collected a sample of responses hoping to demonstrate sampling principles.
Based on the responses we calculated the following summary statistics:
##    Min. 1st Qu.  Median    Mean 3rd Qu.    Max.
##    2.00   30.00   50.00   86.74   73.00 1000.00
At first glance, the sample mean of £86.42 seems unusually high. If we consider the prices of popular titles like Witcher 3 (£50) and Grand Theft Auto V (£40) at the time we would say that the average price for the AAA game was somewhere between £40-£50. But why is there such a large discrepancy between the students’ estimate and the reality?
The answer lies in the distribution of the data. The sample mean is a poor indicator in this example because the distribution of price estimates is highly skewed. The presence of extreme outliers, most notably the maximum value of £1000.00, has pulled the mean significantly higher than the central tendency of the data. Furthermore, the sample itself was not very large, it was just 50 observations, and because of that the impact of one large outlier would distort the estimate substantially. The median, at £50.00, however, provides a much more reasonable and representative estimate of the “typical” price because it is not influenced by outliers as much as the mean.
This example also shows that the quality of a sample can depend greatly on the knowledge of the participants. In this survey, students who regularly played computer games provided more precise estimates. Their responses were characterized by a lower mean and, crucially, lower variance. In contrast, the price estimates from those who did not play computer games had a much more skewed distribution, contributing to the outliers that distorted the overall sample mean. Figure 6.1 shows the distribution of estimated prices between the two groups.
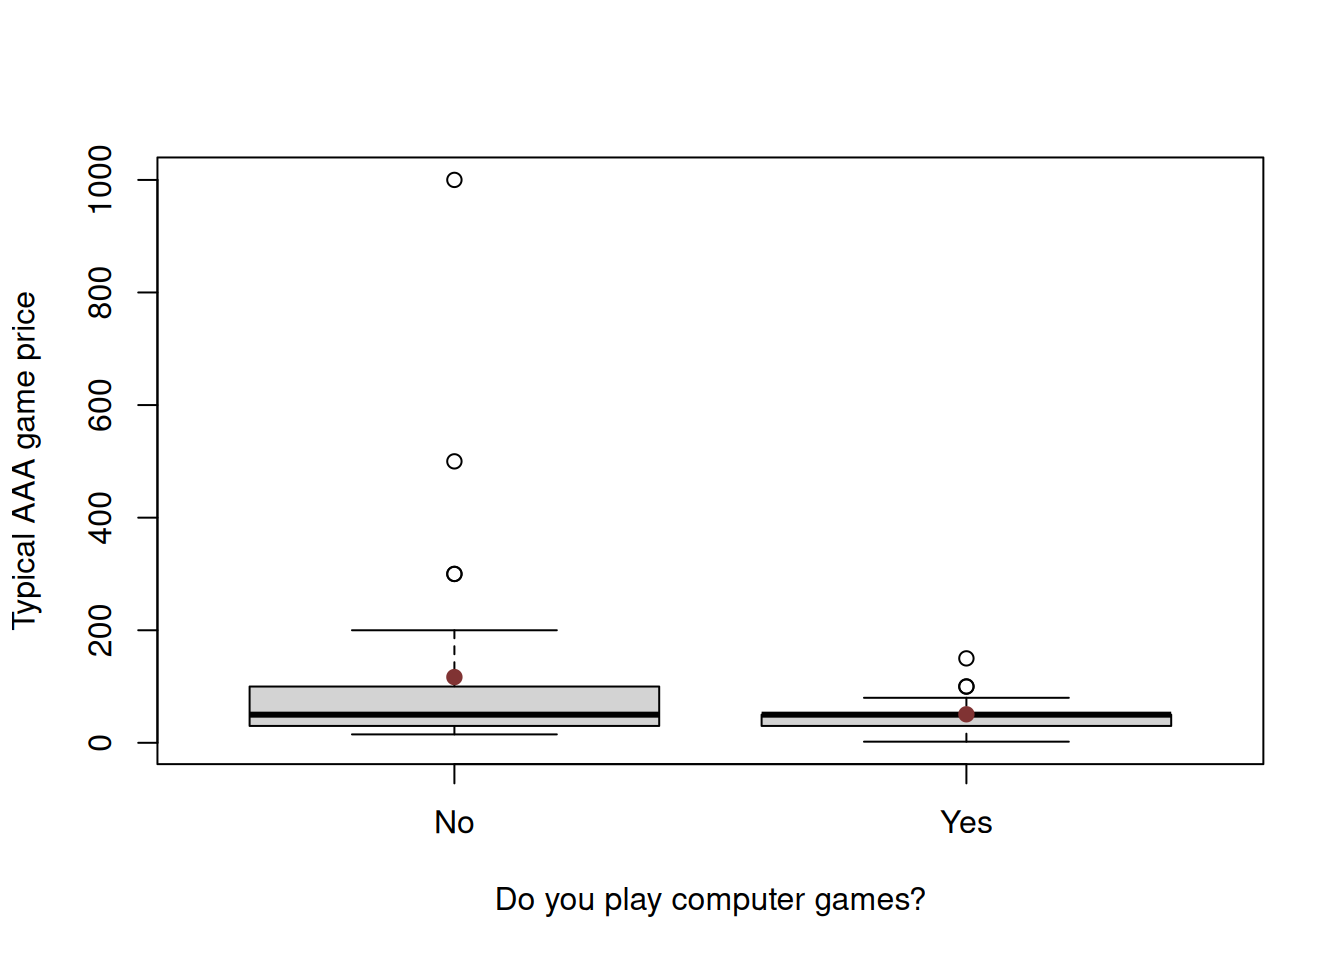
Figure 6.1: Distribution of responses about the AAA computer games prices.
What this example shows is that the sampling of data plays an essential role in estimating specific parameters. To get a better estimate of the average AAA game price in our case, we either need to have a sample of people that know what it is (i.e. play computer games), or have a much larger sample, for which the outliers would not be as influential as in our example.
Remark. This example also demonstrates an interesting effect, observed real life: the estimates given by group of people tend to converge to the true value, as long as the group is either well informed or large enough. This effect is called in the literature “Wisdom of a crowd”.
6.1.2 Populations, Samples, Parameters, and Statistics
Moving from the specific case, to more general concept, we can define several important terms. A population is the entire group of individuals or objects about which we want to draw conclusions. In the example with AAA games, our population would be all the students at the university. Given that there are around 10,000 of those, asking opinion of everyone would be infeasible, so we only asked 55 of those, forming a sample. A sample is a subset or a small fraction of the population that is selected for examination. Samples can be collected differently, and there are many techniques of doing that, guaranteeing good statistical properties. But whatever you do, we should note that the values we calculate (oe estimate, e.g. arithmetic mean), would always have randomness in them due to sample being just a small portion of the population. If we change the sample or increase it by collecting more observations, the calculated values would change as well. This is a fundamental law of statistics, which needs to be considered whenever we make sample-based inference.
If we use sound sampling techniques, the estimates of parameters will have good statistical properties (discussed in the following sections of this chapter). The sample in this case would be called “representative”, i.e. it is a subset of a population that accurately reflects the characteristics, proportions, and diversity of the entire population from which it is drawn. Critically, sample size alone never compensates for lack of representativeness. A large but biased sample remains unrepresentative, while a smaller, properly selected sample can yield accurate inferences. The key distinction is that while no single sample is guaranteed to be perfectly representative, proper probability sampling methods guarantee representative samples “over the long run” across many samples.
There are several sampling techniques, the most common and foundational of which is the simple random sample. Below, we briefly discuss some of them, outlining their advantages and disadvantages.
6.1.3 Simple Random Sampling (SRS)
The Simple Random Sample (SRS) is the method useful when we deal with cross-sectional data, designed specifically to produce representative and unbiased samples. It relies on the following three principles:
- Equal Probability: Every individual member of the population must have the same chance of being selected for the sample. This principle ensures that no part of the population is systematically over- or under-represented.
- Independence: The selection of one member must be independent of the selection of any other member. This means that the choice of one individual has no influence on the choice of any other individual. This prevents biases that can arise from clustering, such as selecting a group of friends who may share similar characteristics.
- Equal Sample Likelihood: Every member of a sample of a given size \(n\) must have the same probability of being selected. This is the most comprehensive condition and ensures that the sampling process is truly and completely random.
The exact procedure for drawing a simple random sample depends on the nature of the population:
- For an infinite population (or one so large that it can be treated as such), the process is straightforward: one simply draws n values independently.
- For a finite population, the theoretical ideal is sampling with replacement. After an individual is selected, they are returned to the population pool, ensuring that the probability of selection remains constant for every draw and that the selections remain independent.
In the real world, however, sampling without replacement is far more common: a person is typically not surveyed twice for the same study. When this method is used, the statistical formulae for things like variance may need to be updated with adjustments, such as the “finite population correction factor”, especially if the sample size constitutes a large fraction of the total population size.
Advantages: This method represents the purest form of probability sampling with no inherent bias. It provides a solid foundation for statistical inference (see Section 6.4). This is why most textbooks favour simple random sampling in theoretical discussions.
Disadvantages: The primary limitation is the requirement to enumerate the entire population, which is often impractical, time-consuming, or impossible. Additionally, simple random sampling is subject to sampling variation: by chance alone, a relatively small sample might be atypical of the population. For instance, when randomly selecting staff members from a company for interviews, you might accidentally select only junior employees, missing the perspectives of senior management entirely, even though the selection mechanism itself was unbiased.
6.1.4 Systematic Sampling
Systematic sampling involves selecting every \(k\)-th element from the population after choosing a random starting point between 1 and \(k\). For example, with \(k=100\) and \(r=57\), the sample would include the 57th, 157th, 257th, and so forth.
Advantages: This method can be implemented “as you go”, without requiring the complete population list upfront. It is conceptually simple and easy to explain. For example, a museum surveying every 50th visitor or a quality control inspector examining every 100th car produced. Systematic sampling often ensures greater variety than simple random sampling because selections are spread throughout the population. Museum visitors, for example, would be sampled throughout the day rather than potentially clustered at one time.
Disadvantages: While every individual has an equal chance of selection, not every combination of individuals does. If one person is chosen, their immediate neighbours cannot be. More critically, systematic sampling can introduce bias if there are periodic patterns in the population. For example, checking newspaper typesetting every 28 days would always sample the same day of the week, potentially missing day-specific patterns.
6.1.5 Stratified Sampling
In stratified sampling, the population is divided into homogeneous subgroups (strata) based on characteristics such as age, gender, income, or geographic region. Samples are then drawn independently from each stratum, either proportionately (equal sample sizes per stratum) or disproportionately (larger samples from more variable strata).
Example: A pie company conducting quality control might stratify by pie type, production factory, and day of the week, creating strata to have specific characteristics. e.g., one of them would be for pork pie, Lancaster factory, Tuesday. This ensures that pies from all combinations of characteristics are represented in the quality assessment.
Advantages: Stratified sampling significantly reduces sampling variation and produces more representative samples. It avoids the risk of unusual samples that can occur by chance in simple random sampling and ensures coverage of population variety. The between-stratum variation is captured systematically rather than left to chance, leading to estimators with lower variance and greater confidence in inference.
Disadvantages: Stratified sampling requires identifying relevant strata in advance and having information about which stratum each population member belongs to. The effectiveness depends on choosing strata where within-stratum variation is small relative to between-stratum variation. And, for example, stratifying by first letter of surname would be meaningless for most research questions.
6.1.6 Cluster Sampling
Cluster sampling divides the population into clusters (e.g., geographic regions, schools, product batches), randomly selects some clusters, and then either samples from or includes all members of the selected clusters. There is also multi-stage cluster sampling, which involves selecting clusters within clusters (e.g., counties within provinces, then streets within counties).
Example: Surveying households might involve randomly selecting counties, then randomly selecting streets within those counties, and finally randomly selecting households on those streets.
Advantages: Cluster sampling is often substantially cheaper and quicker than other methods, particularly when the population is geographically dispersed. It reduces the logistical burden of accessing population members spread across a wide area.
Disadvantages: The method assumes that clusters are “mini populations” representative of the whole. If clusters differ systematically, for example, if selected neighbourhoods are predominantly wealthy, the sample will be biased. The quality of inference depends critically on the homogeneity of clusters relative to the overall population.
6.1.7 Quota Sampling
Quota sampling combines stratification with convenience sampling. Strata are defined (e.g., age-gender groups), and interviewers fill quotas for each stratum by conveniently selecting individuals until the target number is reached.
Example: A high street survey might aim for 100 respondents in each of six age-gender groups: {females < 25}, {25 < females < 50}, {females > 50}, {males < 25}, {25 < males < 50}, {males > 50}. Interviewers approach people until each quota is met.
Advantages: Quota sampling is more practical than fully stratified random sampling, particularly in field settings where random selection within strata is difficult. It provides better coverage than pure convenience sampling by ensuring representation across key demographic groups.
Disadvantages: Within each stratum, convenience sampling is used, making it very difficult to avoid serious bias. Interviewers might unconsciously select approachable, friendly-looking individuals, or avoid certain neighbourhoods, introducing systematic bias even though quotas are met.
6.1.8 Convenience Sampling
Convenience sampling involves selecting whoever or whatever is easily accessible, e.g. choosing friendly-looking people in market research, items on top of a pile in quality control, or current customers when seeking feedback about new products.
Advantages: It is extremely quick and cheap.
Disadvantages: Convenience sampling is highly prone to bias. One of the classical examples involves a student studying M6 motorway traffic who, for convenience, counted only vehicles in the fast lane and concluded there were no lorries on the M6. The sample fundamentally failed to represent the population of interest.
6.1.9 Voluntary Response Sampling
Voluntary response sampling involves inviting a group to respond, for example, through internet surveys, customer satisfaction questionnaires, or radio phone-in polls.
Advantages: This method is cheap and quick to administer.
Disadvantages: Response rates can be extremely low (often around 5%), and those who respond are not representative of the population. Individuals with strong opinions (particularly negative ones) are more likely to respond, introducing severe bias. TripAdvisor reviews is an example of this, because dissatisfied customers are disproportionately motivated to leave feedback.